


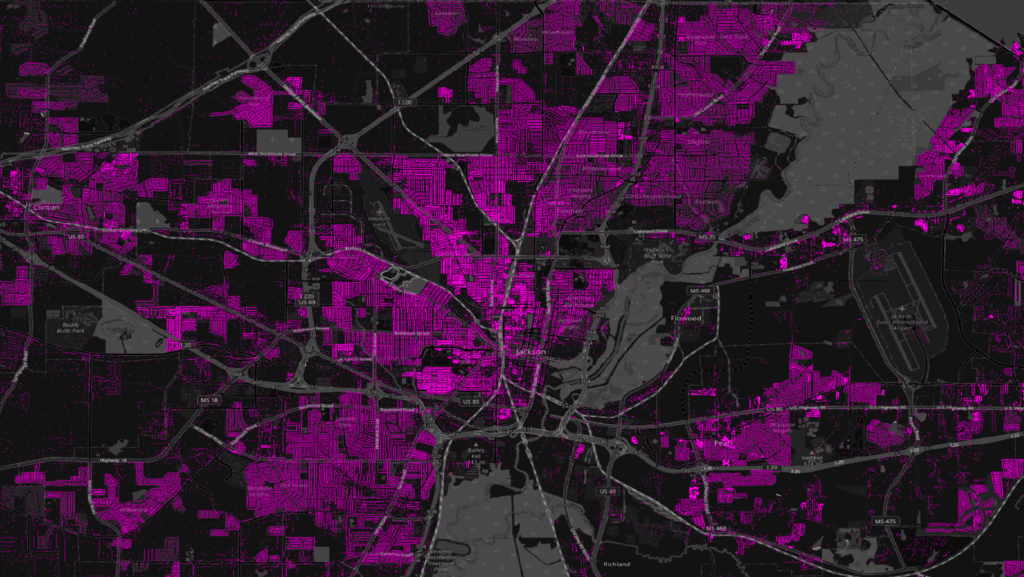
Coverage in Jackson Mississippi
To the uninitiated, address data appears simple. Scrawl an address on an envelope and a postal service will deliver it to the specified destination. However, the data enabling these systems is a complex mess of unique local formats, thousands of data sources, and obscure rules that at times seem nonsensical.
Finding, evaluating, and combining these sources, so you don’t have to, is Overture’s core work. Today, our addresses dataset includes nearly 200 data sources representing over 450 million addresses, and growing.
In a recent release, we added coverage for the US state of Mississippi. Though it’s a small slice of the address pie, the story of how we assembled Mississippi addresses is a perfect example of our larger work, involving plenty of detective work, complex engineering, and careful data reconciliation.
The Goal: One Format, One Release, All Addresses
What does our address data look like after it’s gone through our process? One data format, one data release, containing all the addresses, complete coverage, and unified schemas so you can query everything in one location.
Getting to this point is surprisingly hard.
The Hidden Complexity of “Simple” Address Data
Counties manage their addresses, usually. But it doesn’t always work that way. You would think it would make sense for America to have a single data source of addresses, but only recently did they even decide this was something they wanted to achieve. The United States Department of Transportation maintains a National Address Database (NAD) for the US. This is open address data aggregated from across the nation. The problem is that participation has been spotty. NAD covers many states, but that still leaves blank states. And those states that are left over don’t all look the same and have their own unique ways for dealing with the problem.
At Overture, the first thing we did was ingest NAD. Now we’re starting to fill in the gaps so that we can provide complete coverage.
Mississippi: From 82 Counties to One Dataset
We’re going to talk about one example to illustrate how hard this is and why we’re doing it so that no one else has to do it again.
Mississippi isn’t part of the National Address Database. There’s no agency that maintains a true statewide dataset, but it turns out they do have much of this data gathered within their Mississippi Automated Resource Information System (MARIS): a clearinghouse for GIS data within the state.
In Mississippi, there are 82 counties, and only 25 of them have their own address points. So we have to take each of those county’s datasets and pull them together. But we don’t just want to cover 25 counties, we want to cover all of them.
There is actually a statewide dataset that’s available, but its parcel data. Parcels have addresses, but within a parcel, you might have multiple buildings with unique addresses, or units like A, B, C, or D. In a parcel dataset, you’re not going to capture all of that granularity. You get less complete coverage than you would from an address point database, but parcel data is still very useful. This created an interesting quality hierarchy problem that’s common in our work. We generally want address point data when possible, but parcels can be valuable as well. By taking the best we can get and mixing it with the second best, we can have a complete database for now and improve it in the future.
The challenge then becomes unifying these address points with parcel data, taking the high-quality points when available and falling back on parcels when necessary.
Here’s how we accomplished this: we’re building a pipeline that knows which data to prioritize where, and how to seamlessly merge different quality levels into one coherent dataset. This process sounds straightforward, but it requires careful spatial analysis, county-by-county validation, and custom Python scripts to handle the data reconciliation.
Between these two datasets, we achieved something significant: complete state coverage.
The results: Now we have complete coverage of Mississippi that anyone can access for free, and they don’t have to replicate our work.
The Technical Process
Our starting point is a project called OpenAddresses, which allows us to normalize the data to a standard schema very similar to our Overture schema. From there, we use Python and Spark scripts to load the data we need.
In the US especially, our data is now a mosaic of multiple, often overlapping datasets and the real engineering challenge comes in eliminating these overlaps without losing valuable data. From the National Address Database (NAD), we cut out whole states along with individual counties in favor of datasets directly supplied by the source. For Mississippi, we had to use a similar approach to trim out the extraneous parcel data in counties with addresses. This requires defining each dataset, mapping county codes, and using geographic intersections to remove duplicates systematically.
We also implement quality control measures. We constrain datasets within bounding boxes, taking the county shape and making a bounding box so anything outside gets trimmed automatically. It’s an easy way to catch simple data errors. Additionally, we filter out more dataset specific issues like null geometries or invalid datatypes.
We look for other common issues too. Many datasets might have text strings that say “no data” instead of actual values, and we can drop those when we find them or receive feedback. Some sources in NAD have cities labeled as “unincorporated” (places that are just in the county without an actual city designation). Since that’s not a valid city, we filter those out.
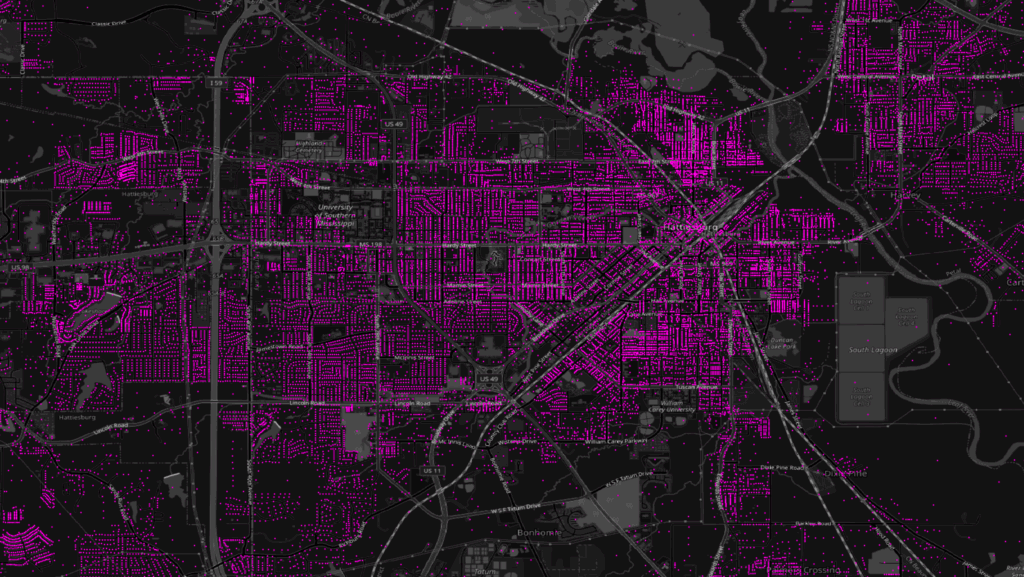
Coverage in Hattiesburg, Mississippi
The Challenges Are Real
The technical work is only part of the challenge. A lot of data isn’t well documented, so we can spend considerable time finding data, but if we can’t get a clear answer on how it can be used, we’re just not using it currently.
This licensing uncertainty is genuinely frustrating. There’s good data out there, but the license or usage limitations are not defined anywhere. If you try to reach out to the source, oftentimes no one responds, and it’s a bummer because we’d love to bring it in.
The maintenance burden is equally complex. There’s data that has no consistency, releases with random file names, or in new places every time. This requires manual intervention because there’s no simple way to automate ingestion when you don’t know when it’s going to be updated or what it’s going to look like.
Quality control becomes a delicate balance. It’s a struggle to fix bad data but not drop good data, and maintaining that balance is something we’re always working on. For example, zero is typically not a valid number in addressing, but there are plenty of buildings that have zero as their address number. There are always exceptions to the rules.
Global Application
What we do for Mississippi, we do for the entire world. The same process of finding scattered datasets, understanding their formats, normalizing schemas, and integrating them applies whether we’re working with Japanese block-based addressing, Greenland’s dual numbering system, or European administrative hierarchies.
Norway has two completely different address formats for urban versus rural areas, requiring separate processing pipelines. While in Greenland, these systems are combined and a location will have both a street number and a building number. Japan uses block-based addressing that doesn’t map cleanly to our street-based schema. Some countries release data in 20,000 separate files. Others change their file names and locations randomly with each update, making automation difficult or impossible.
The normalization challenge is enormous. Some datasets have the entire address in one column that needs to be parsed. Others split the street name into five separate parts (prefix, name, suffix, type, direction) that need to be reassembled. Some spell out “Street,” others abbreviate to “St.” Some use “unincorporated” as a city name, which isn’t actually a city.
Every dataset requires research into local addressing standards, mailing conventions, and administrative hierarchies. For each country, we’re learning how their addressing system works before we can figure out how to fit it into our unified schema.
We’ve expanded beyond the initial handful of European countries and the US and Canada to include countries and regions like Taiwan, Hong Kong, Japan, and much of South America (thanks to AddressForAll Institute), and Mexico. Each integration teaches us something about how addressing works globally and improves our ability to handle the next dataset.
What This Enables
The value is having the data standardized, validated, and ready to use. When we release this Mississippi dataset, developers and businesses get complete statewide coverage instead of hunting through dozens of county websites, a unified schema instead of learning 25+ different data formats, quality validation with spatial constraints and error filtering, licensing clarity, and Global Entity Reference System (GERS) integration for future interoperability.
Geocoding (converting addresses to geographic coordinates) is fundamental to countless applications. Whether you’re routing deliveries, analyzing markets, or building location-based services, you need reliable address data. Having it scattered across dozens of sources in incompatible formats makes it effectively unusable for most organizations.
Many companies have done this work before to bring all these address datasets together, but they do this all internally. That’s a lot of duplicate work. Our work eliminates this redundant effort across the industry.
The Future with GERS
Right now, we’re still cutting out overlapping datasets rather than merging them intelligently. This works, but it’s not ideal. With GERS IDs, we’ll eventually be able to merge multiple sources for the same addresses, creating richer and more accurate data.
Imagine having parcel data, address points, and commercial datasets all contributing to a single, authoritative address record with one stable GERS ID. Instead of choosing between datasets, we could combine their strengths. The engineering challenges are significant (we need better matching algorithms and more normalized data) but the potential is enormous.
Feedback and Collaboration
We’re building systems for feedback loops with our data sources. We have many companies using the data, running their own QA processes, and they can identify issues that we can feed back to the original sources. The transparency of our process helps. Our GitHub issues are all public and we encourage feedback and comments.
We’re also developing our violation storage that we want to publish eventually, where any automated errors we find can be published back publicly. Apart from that, if there are contact points for governments or data sources, we can reach out directly. We do reach out often to get clarity on licenses, and some are very responsive.
Working with our task force members has been essential. Paul Heersink is our chair on the Addresses Task Force, and he’s very knowledgeable and helpful for evaluating data licenses, giving feedback, and finding data. Jake Wasserman from Meta set up a lot of our infrastructure and has gotten us through lots of roadblocks in figuring out code and processes. Thierry Jean from Address4All has also been an essential partner for building connections with government agencies and opening up new data.
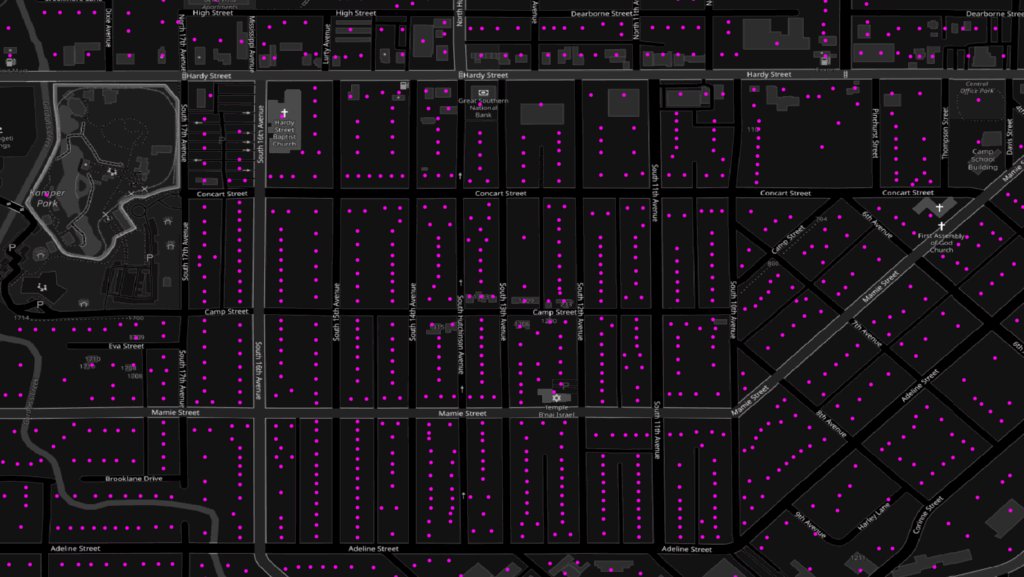
A close up of a neighborhood in Hattiesburg
Looking Forward
When the October release goes live, Mississippi’s complete coverage will be available for the community to use. We want people to use the data, look at it, and give us feedback. We’re still in alpha and we know there’s tons more to do in addresses. We actively respond to any quality feedback we get and have made improvements just this month based on submitted issues.
The long-term vision is ambitious: full worldwide coverage someday. That’s very long-term since most data isn’t open, but we want to get everything we can and normalize it into one good, clean dataset that’s useful to as broad an audience as possible.
Mississippi is one more state down, with still several more to go. But each one teaches us something new about the complexity of seemingly simple data, and each one makes our global dataset more valuable for everyone.
Special thanks to OpenAddresses, a valuable partner in this work, to the Addresses task force members (especially Paul Heersink from Esri and Jake Wasserman from Meta) who’ve been instrumental in building this infrastructure and to the many agencies and individuals who work to create and publish open address data.
Join the Overture Community
The future of mapping is open, collaborative, and built together. Join us in making it happen. Visit our website to learn more about our work and become a member.
Stay connected: follow us on LinkedIn, X, and Bluesky for the latest updates. Sign up for Overture’s monthly newsletter for the latest updates on our journey in transforming map data distribution.
Interested in using Overture data? Check out the Explorer tool, a no-code option for inspecting Overture data and metadata, the data guides for an overview of our six data themes, and the “Getting Data” section of our documentation.